Trade show KPIs for organizers: what to track from stand sales to the post-show report
Most trade show KPI lists are written for exhibitors. These thirteen are for organizers: the formula, and the decision each one should trigger.
By Moultaka team
Search for trade show KPIs and nearly every result talks to the exhibitor: booth traffic, leads, cost per lead. The person running the show needs a different list. Thirteen metrics cover it: four for stand sales, three for preparation, four for the show days and two for the result. Each has a simple formula, and each should trigger a decision. If nobody would act when a number drops, it does not belong on your dashboard.
Leading and lagging: the two kinds of trade show metrics
Total attendance is the number everyone quotes, and it arrives too late to change anything. Trade show success metrics fall into two groups:
- Leading indicators can still be acted on: floor space sold ten weeks out, the pace of registrations, exhibitor files still open.
- Lagging indicators tell you how it went, and serve the next edition: margin, cost per attendee, rebooking.
Before the doors open, the first group matters more. Ask three questions of each KPI: who owns it, how often is it read, and what happens if it slips?
Four KPIs for stand sales
| KPI | Formula | The decision it drives |
|---|---|---|
| Space sold | area sold ÷ area available | open a hall, or shrink one |
| Collected against signed | payments received ÷ contract value | chase payments before committing more spend |
| Win rate | deals won ÷ deals opened | change the pitch, or the prospect list |
| Exhibitor retention | returning exhibitors ÷ last edition’s exhibitors | find out why the others left |
A worked example, with invented numbers: 3,000 m² available and 2,100 sold ten weeks before opening is 70%. On its own, that says little. Against 55% at the same date last year, you are ahead. Against 80%, you have a problem and still have time to fix it.
Count area rather than stands, because one large pavilion can hide ten unsold shell schemes. And read exhibitor retention before you celebrate new signatures. A hall can look full for years while a third of its exhibitors quietly leave each edition, until the year new ones fail to fill the gap.
For the work behind these numbers, see how to get exhibitors for an event.
Three KPIs for preparation
- Exhibitor file completion: complete files ÷ confirmed exhibitors. Logo, fascia, team, orders, stand builder. A low rate two weeks out predicts a painful build-up. Chase what is actually missing, one exhibitor at a time.
- Registration pace: registrations at 30 days out, against the last edition on the same day. A running total means nothing without the comparison. Then split it by source to see which campaign or partner really brings people.
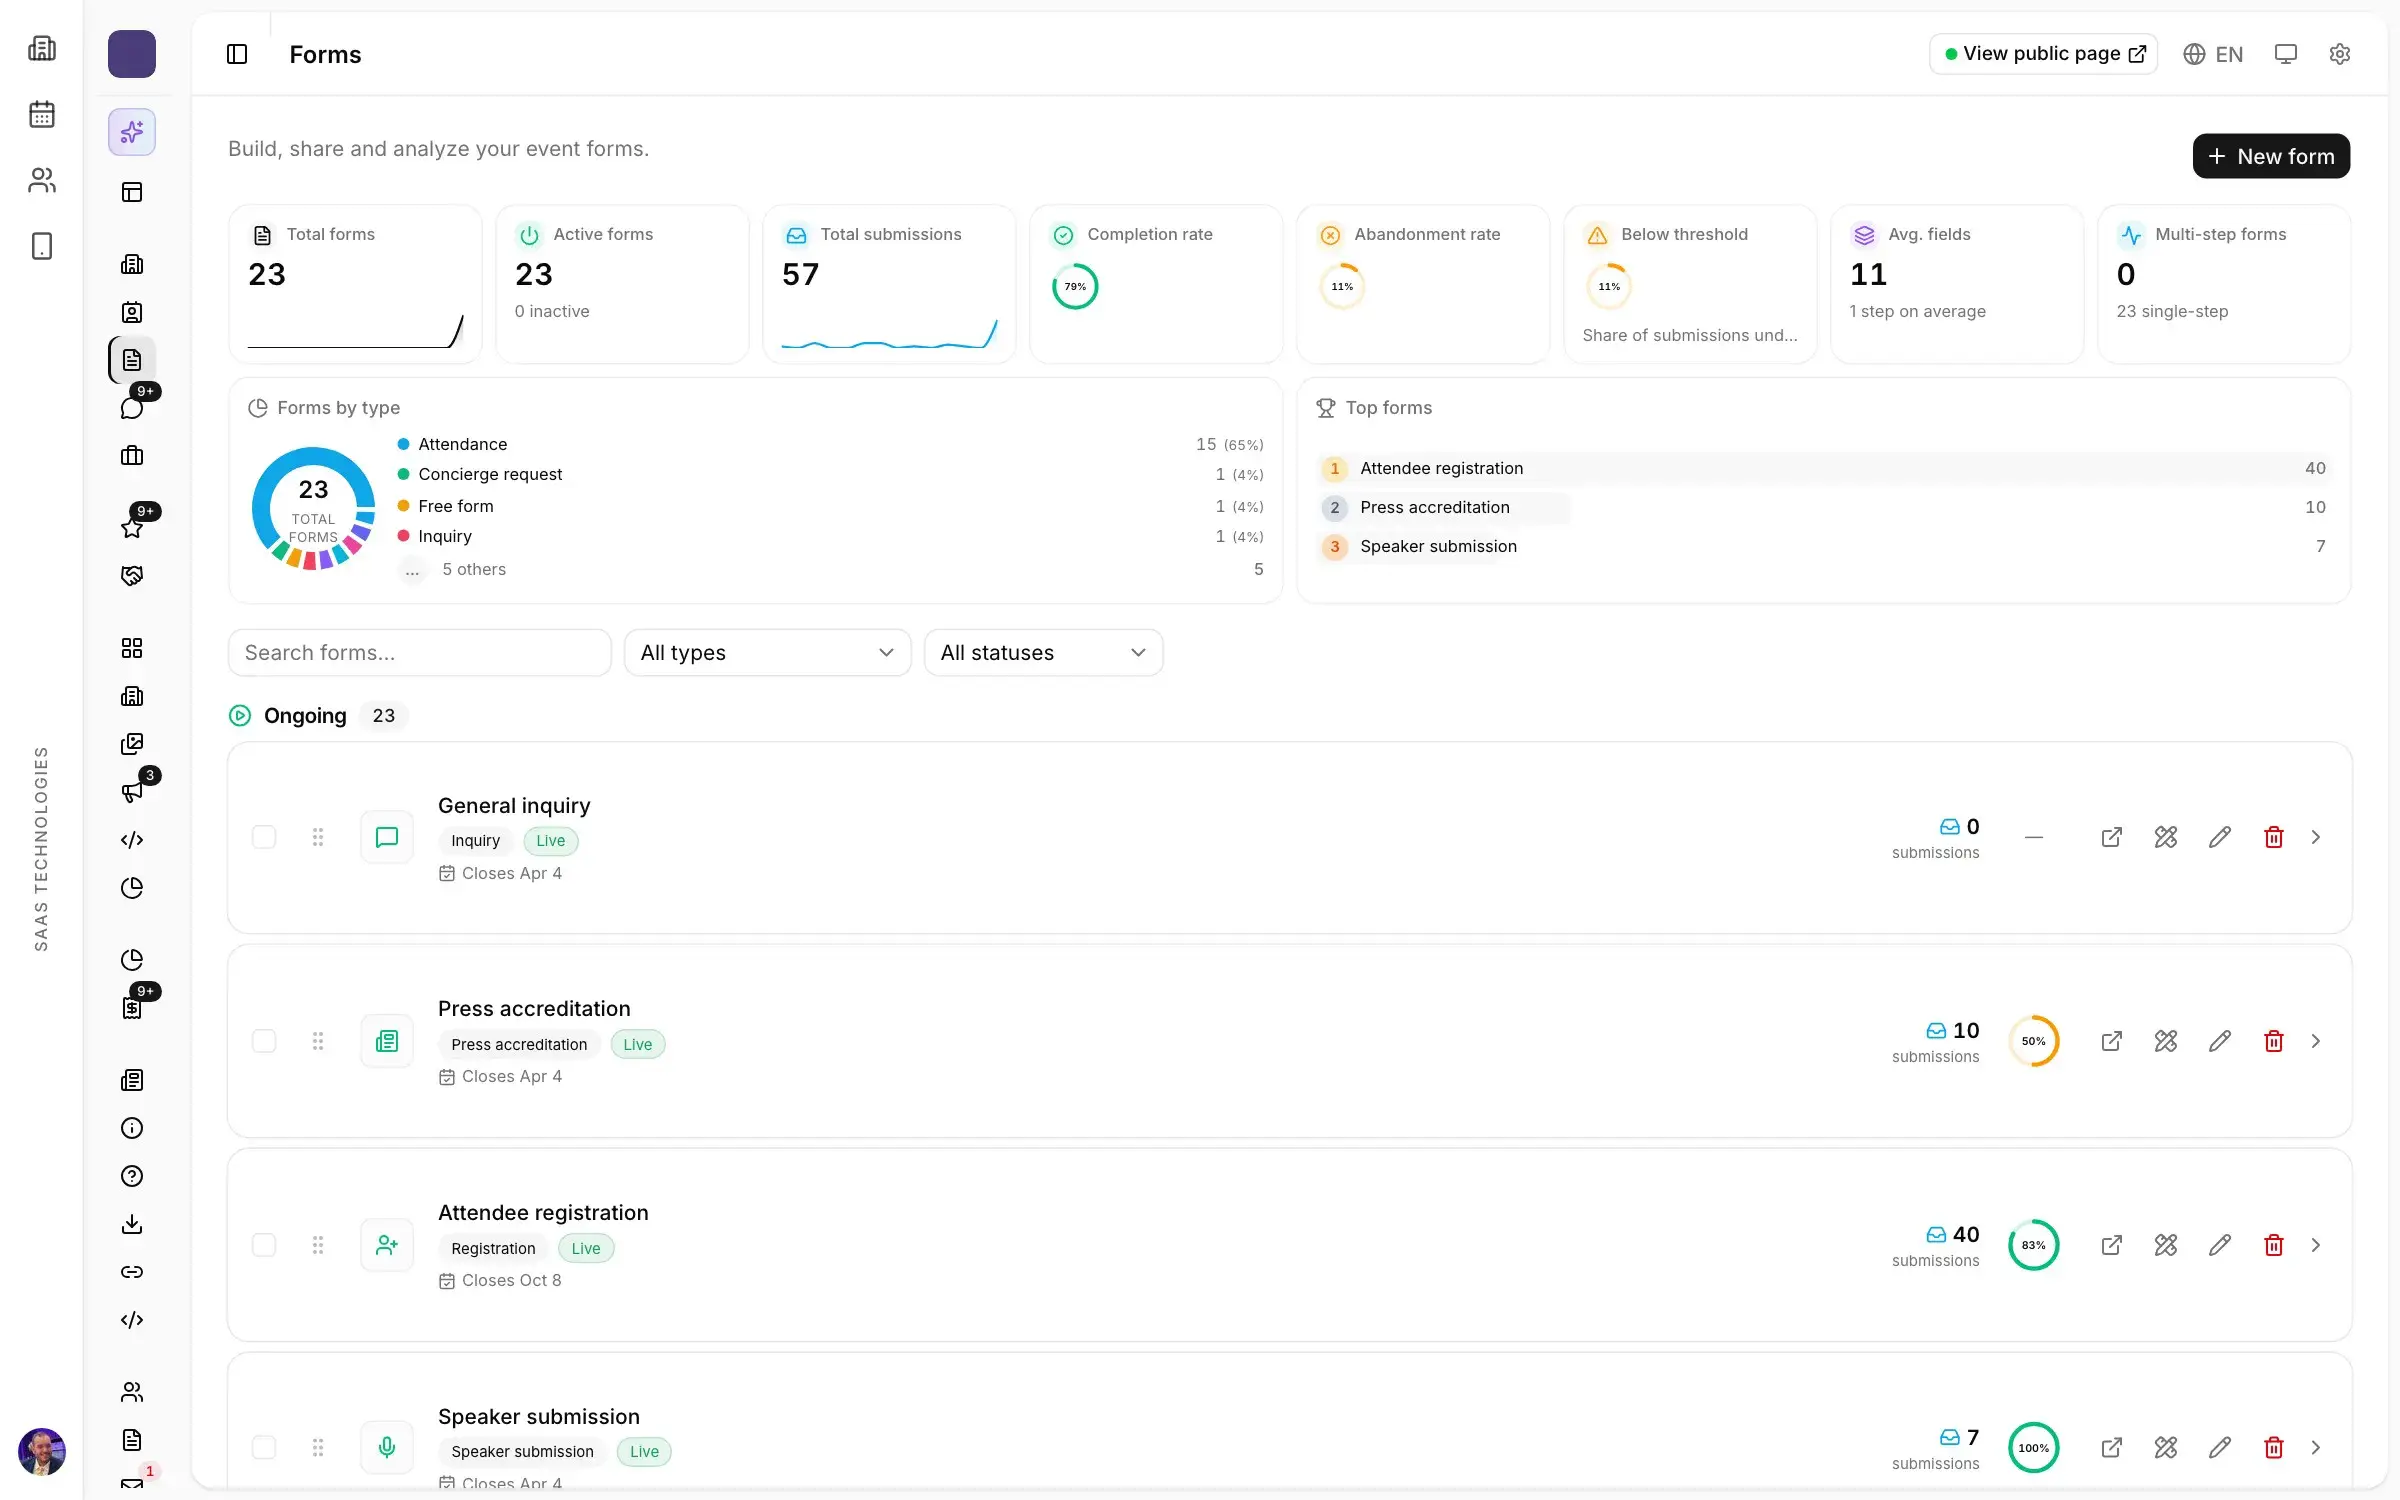
- Form drop-off: forms started but not submitted ÷ forms started. If it is high, the form is too long or one question is stopping people. Fix that before spending more on promotion.
Four trade show performance metrics for the show days
These are read within the day, and they are the only ones you cannot rebuild afterwards.
- Unique attendees and no-shows: people who actually came through the door, each counted once. The method is in how to calculate your event no-show rate.
- Flow by gate and by hour: one gate choked at 10 a.m. while another stands empty can be fixed that same morning by moving staff or a kiosk.
- Session attendance: people present ÷ room capacity. A half-empty room next to an overflowing one is a programme lesson for next year, and sometimes a room swap for tomorrow.
- Meetings held and leads per exhibitor: the completion rate of your B2B meetings and the badge scans per stand. An exhibitor with no scans on day one may not have understood the tool. Walk over and show them, while it can still help.
Two KPIs for the result
- Edition margin: revenue collected minus expenses paid, against the forecast, read line by line in your trade show budget.
- Cost per attendee: total expenses ÷ unique attendees. It is not a figure to publish, but it lets you compare two editions and judge what an extra campaign or an extra day is worth.
For sponsors, add benefits delivered, pack by pack, because that is what the renewal conversation rests on. All of it ends up in your post-show report, with a different version for each reader.
Setting targets when nobody publishes a benchmark
Reliable organizer benchmarks are hard to find. Most of the numbers online come from vendors, describe exhibitors rather than organizers, and do not explain their method. We found none we would quote for space sold, retention or cost per attendee.
So your benchmark is your own last edition on the same date. For a first edition, the target is simply to measure properly: what you record this year becomes next year’s reference. Set one modest target per KPI, and keep the definition unchanged from year to year. Change the formula and you lose the comparison.
One owner, one rhythm, one page
A KPI nobody owns does not move. Give each one a name and a rhythm:
- weekly, from the start of sales: space sold, collected against signed, retention;
- weekly, from 60 days out: registrations, exhibitor files;
- hourly, during the show: gates and sessions, on the phone of the person who can act;
- the morning after closing: everything else, in the report.
Keep it on one page. Past about fifteen indicators, nobody reads them. Put the checkpoints in your trade show planning timeline like any other deadline.
Reading these KPIs without consolidating a spreadsheet
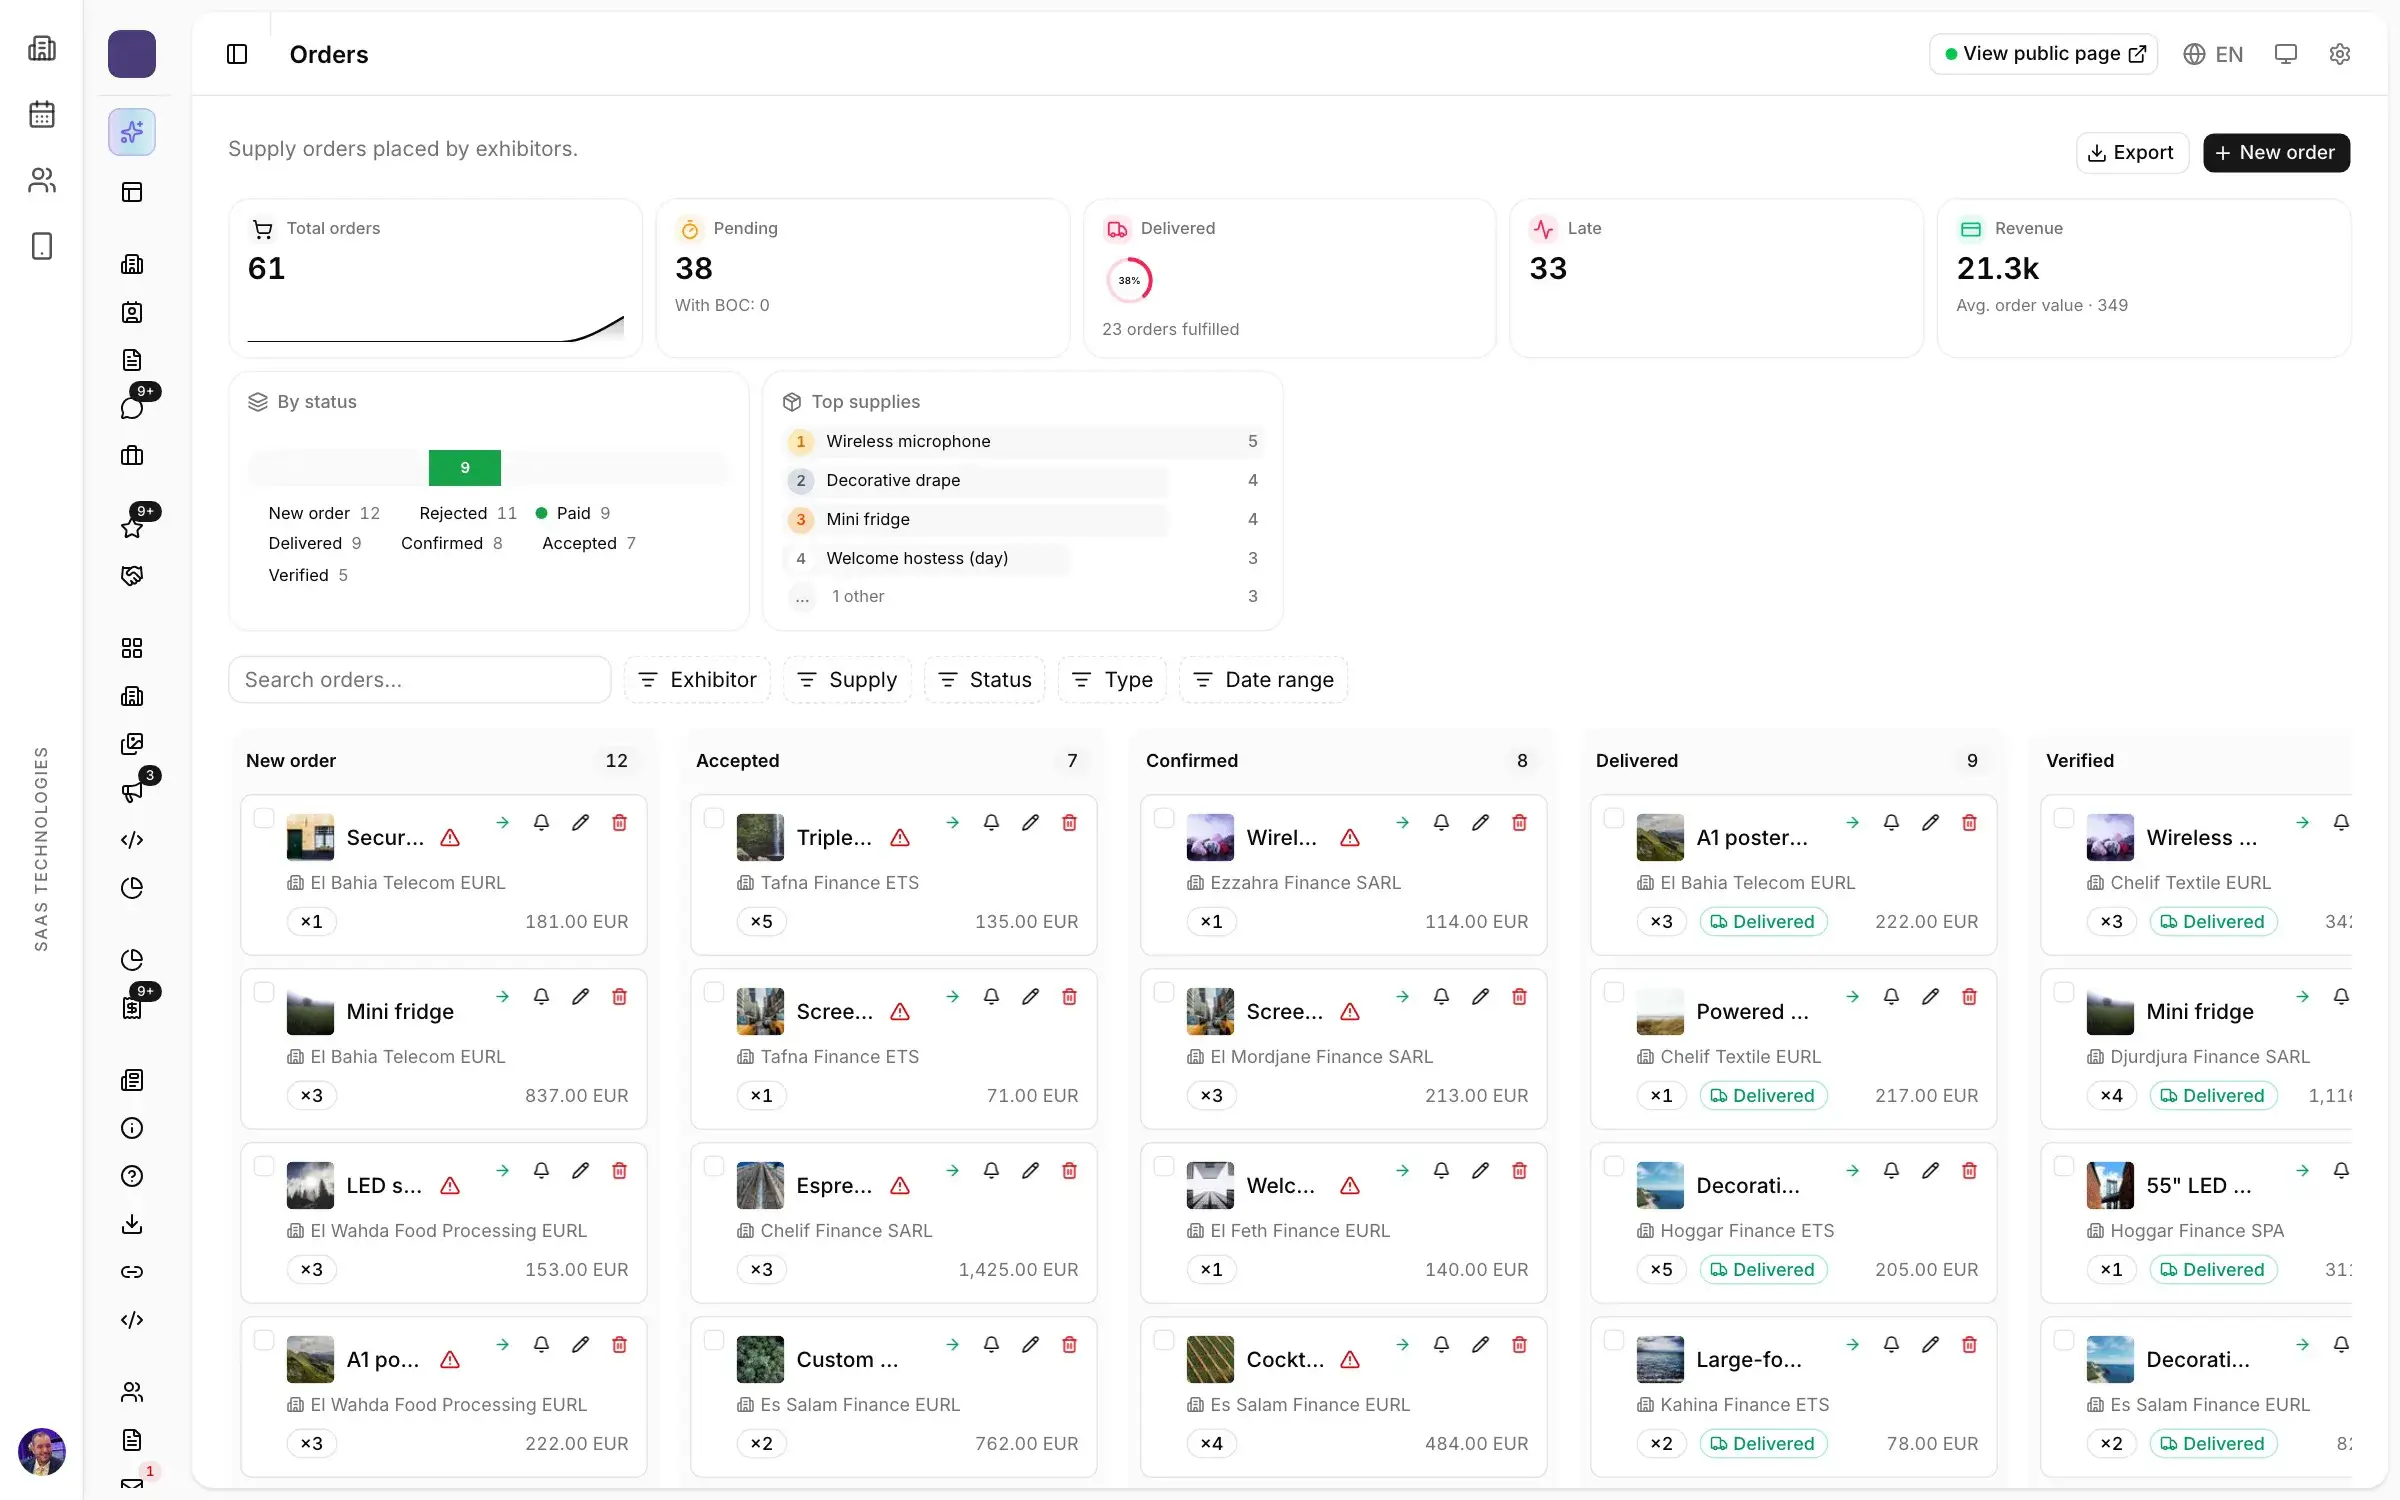
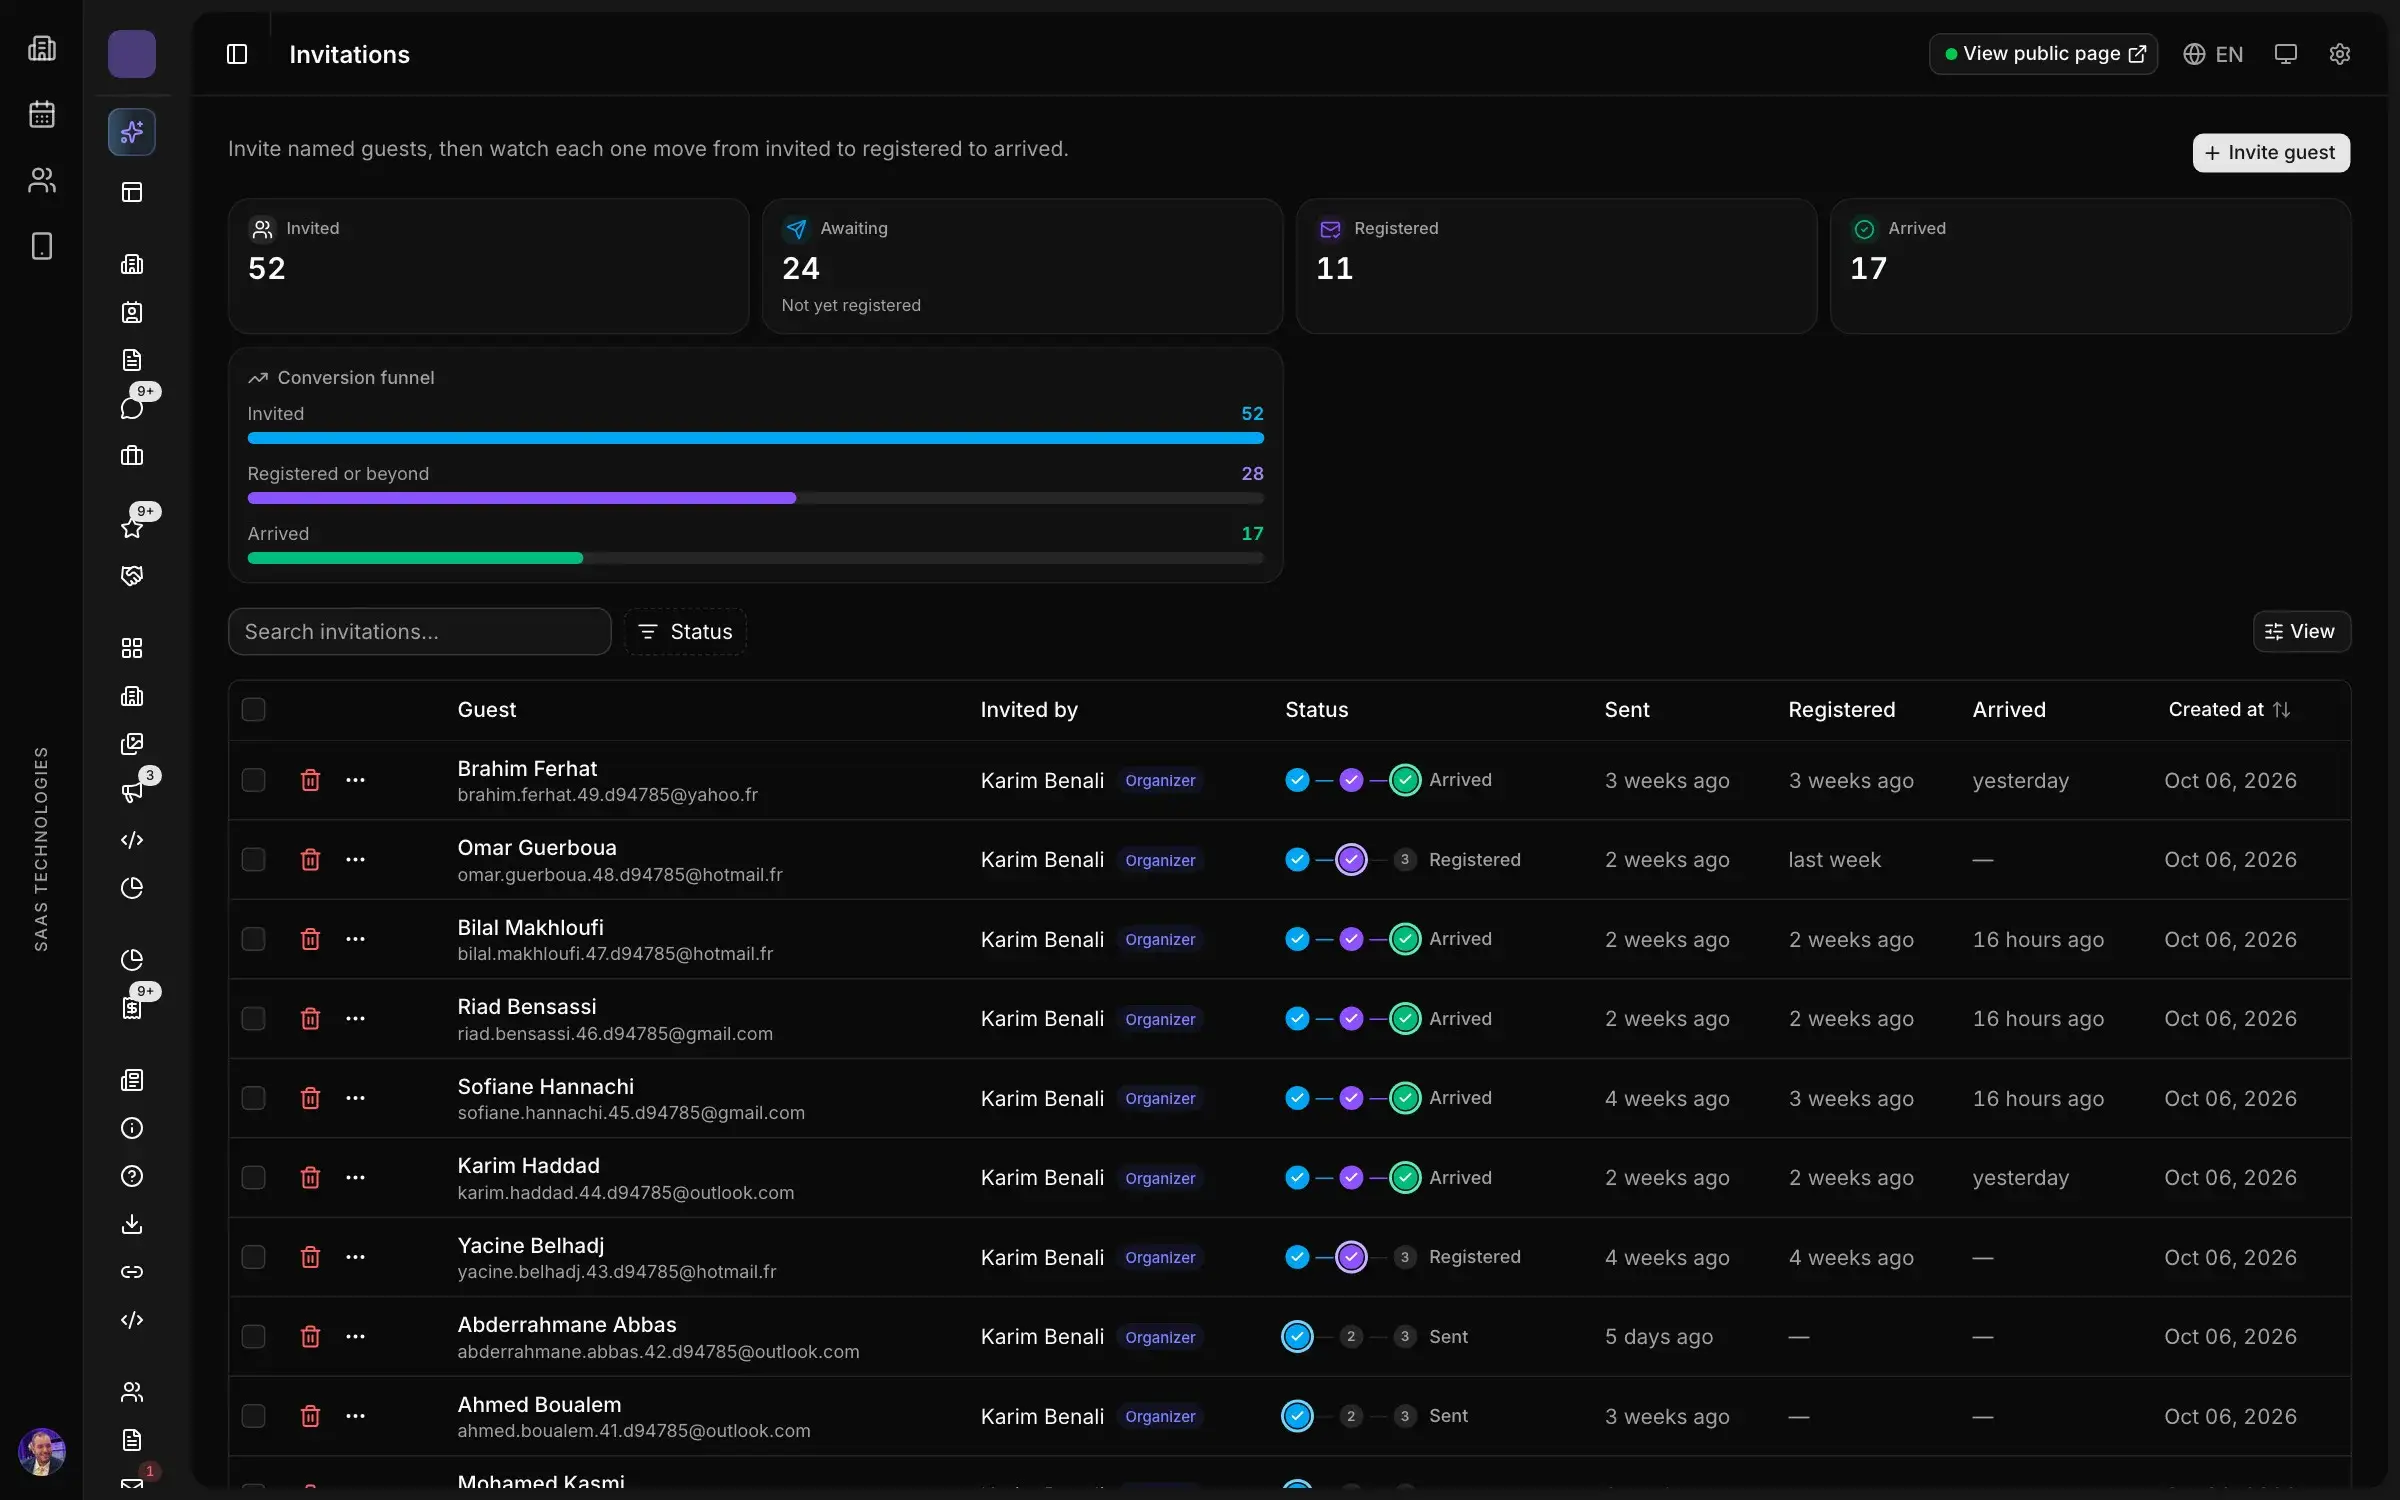
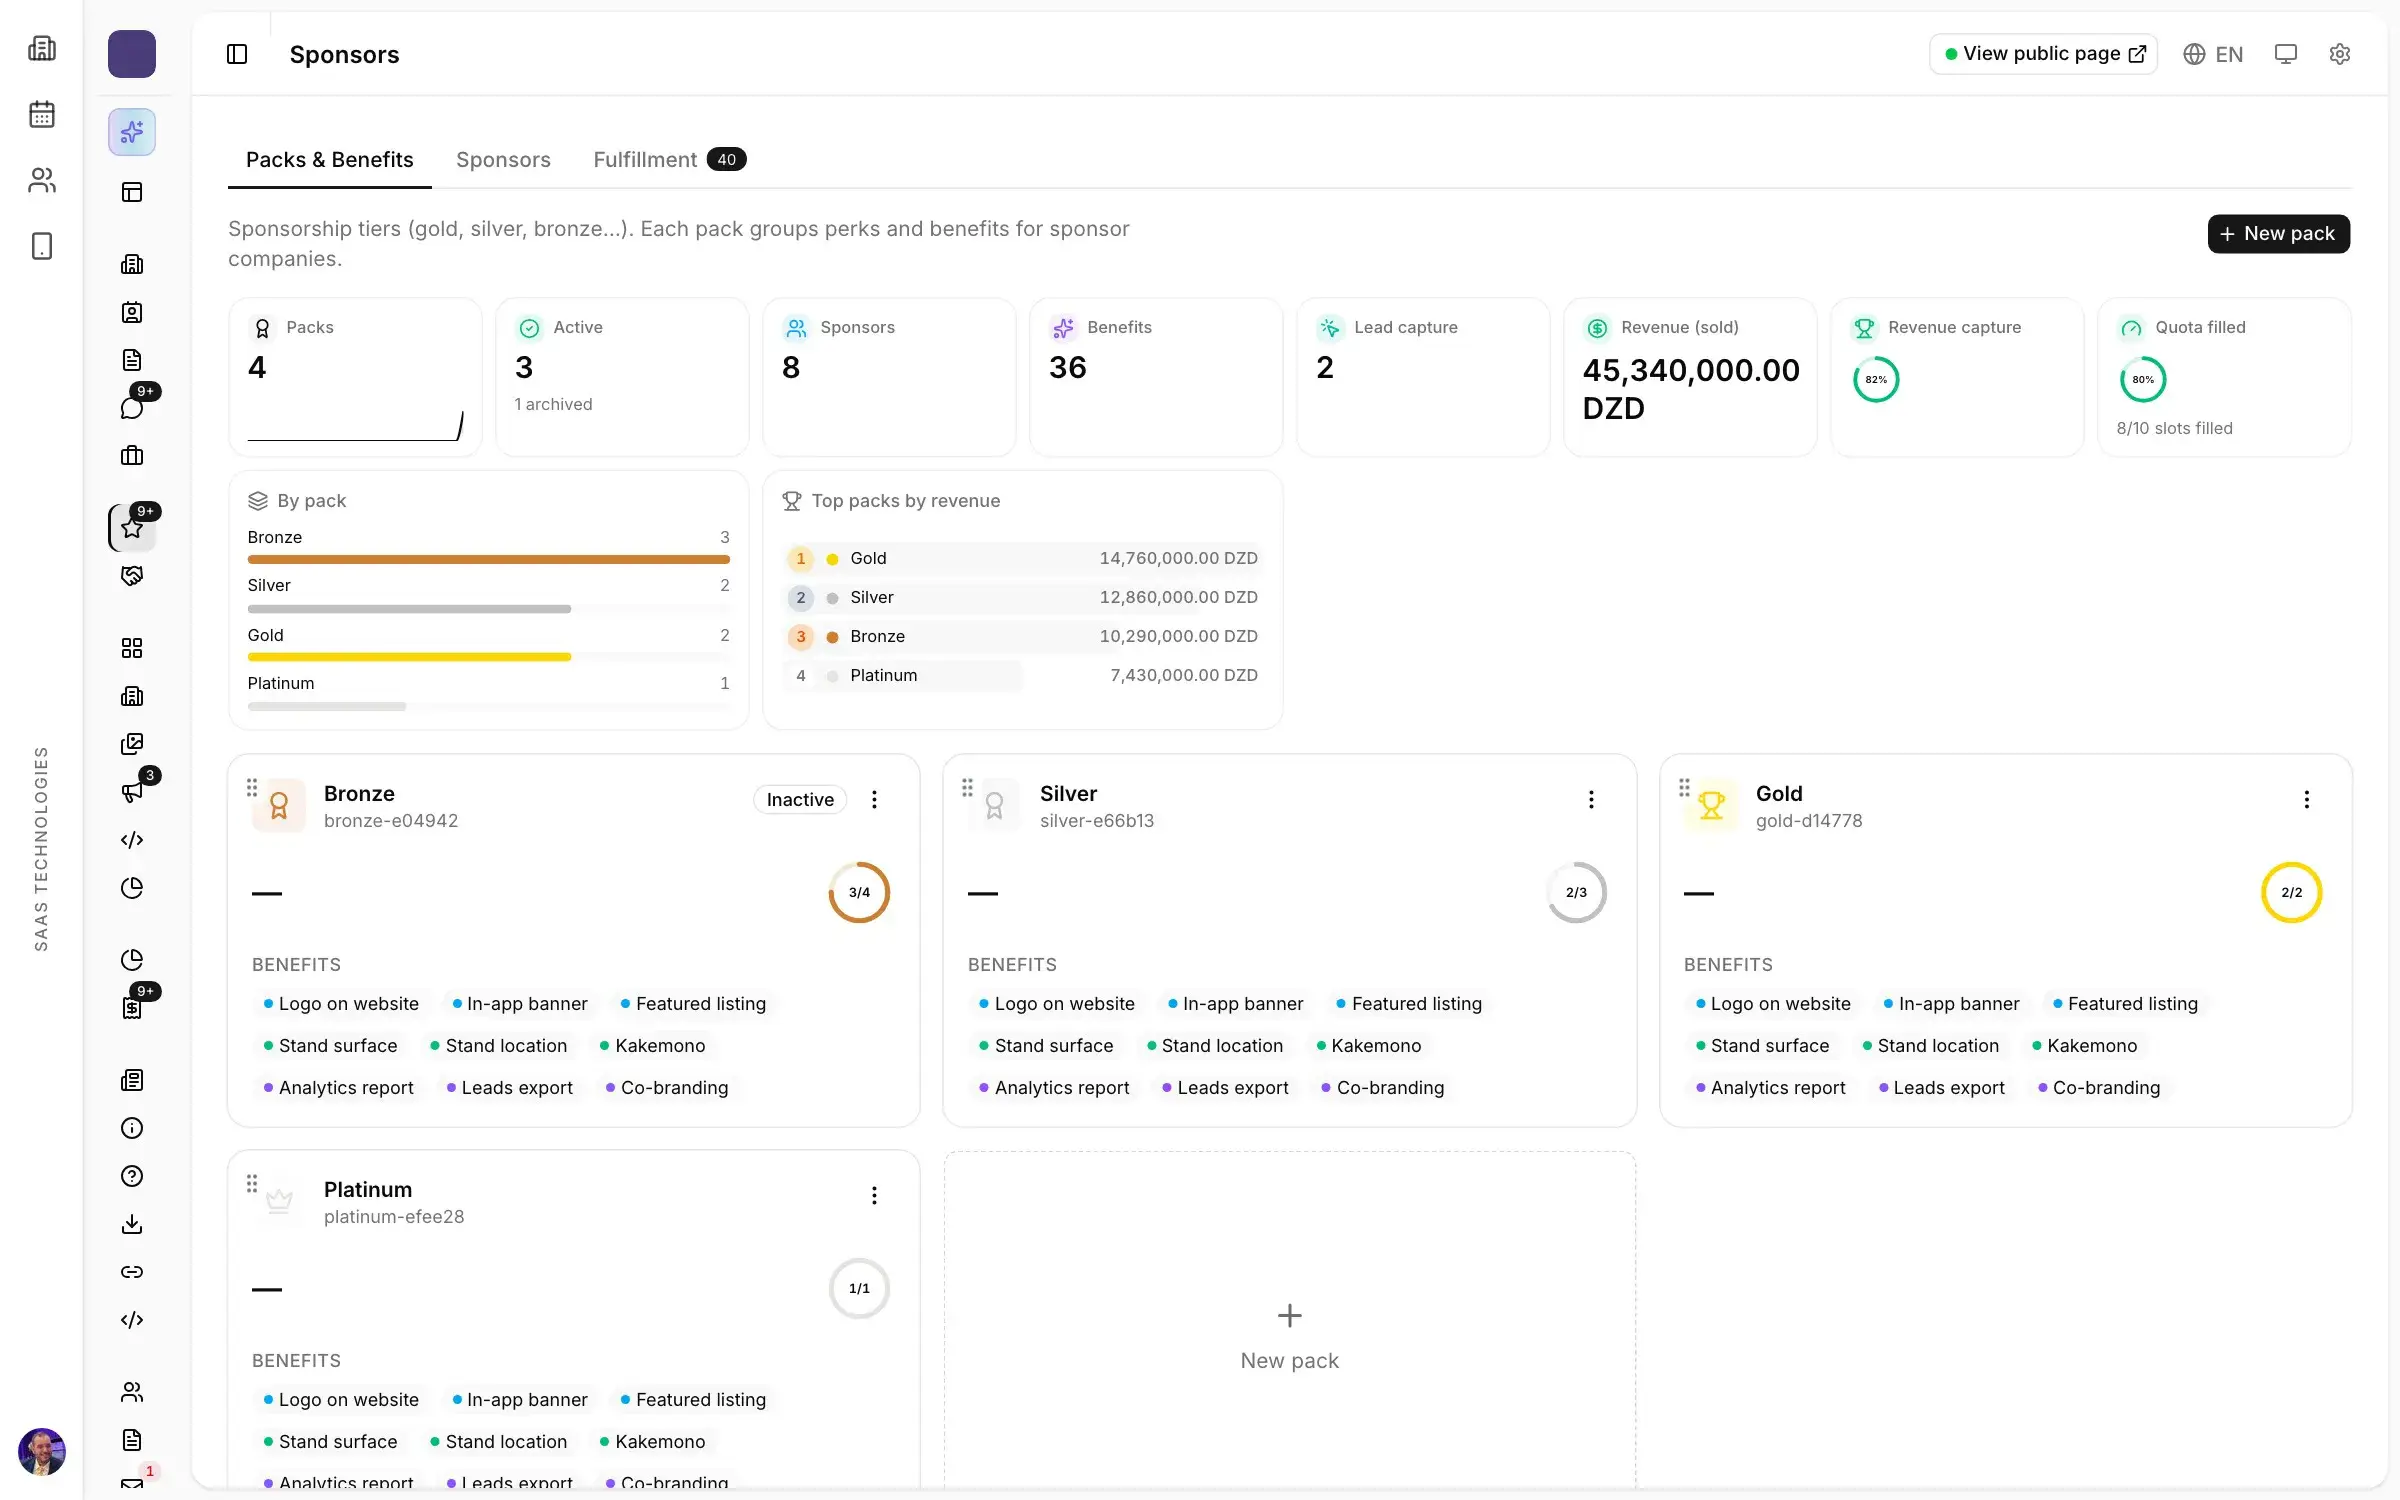
The hard part is not the arithmetic. It is that the numbers live in five files and three inboxes. In Moultaka, every module opens on its own live indicators. Stand sales shows open deals, weighted value and win rate, exhibitors a completion score per file, registration form completion and drop-off rates, access entries by gate, by profile and by hour, and meetings confirmation, no-show and completion rates.
The event analytics dashboard, with budget and the AI assistant, follows budgeted, engaged and paid amounts, and the assistant compares periods and editions from your own data. To see these indicators on your own show, book a demo.